Green Valley Park Dam

Green Valley Park
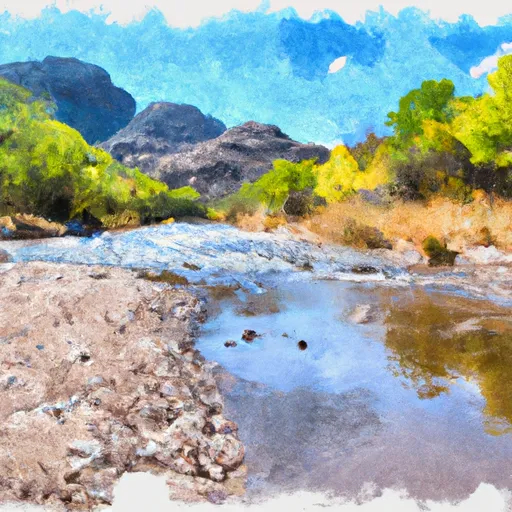
Green Valley Park, located in Payson, Arizona, is a local government-owned recreational area with a primary purpose of providing leisure opportunities for the community. The park features an Earth-type dam on the American Gulch river, completed in 1995, with a height of 13 feet and a length of 1005 feet, creating a reservoir with a storage capacity of 180 acre-feet. The park offers activities such as fishing, picnicking, and hiking in a scenic setting surrounded by nature.
Managed by the Arizona Department of Water Resources, Green Valley Park is subject to state regulations, inspections, and enforcement to ensure its safety and functionality. With a high hazard potential but a satisfactory condition assessment, the dam is regularly inspected, with the last assessment conducted in March 2018. The park's spillway, which is uncontrolled and 450 feet wide, serves to manage maximum discharge rates of up to 9000 cubic feet per second, protecting downstream areas from flooding risks.
Despite its moderate risk assessment, Green Valley Park remains a popular destination for water resource and climate enthusiasts seeking a peaceful getaway in Gila County, Arizona. With its well-maintained facilities, beautiful surroundings, and recreational opportunities, the park continues to attract visitors looking to enjoy the outdoors while appreciating the importance of responsible water management in a changing climate.
Plan around the weather
Same NOAA / yr.no feed Snoflo's iOS app uses. Watch the precipitation column on the meteogram -- rain on the basin upstream typically lifts inflow 24-72 hours later.
Next 5 days, hour by hour
Temperature line with weather symbols on top, snow + rain accumulation as columns, humidity as a dotted line.
5-day forecast table
Every 3 hours, broken out across temperature, snow, rain, humidity, and wind. Each cell is colour-coded relative to the column min/max.
| Time | Condition | Temp (°F) | Snow (in) | Rain (in) | Humidity (%) | Wind (mps) | Wind dir |
|---|---|---|---|---|---|---|---|
| Loading detailed forecast… | |||||||
15-day temperature & precipitation
Daily temperatures, snow, and rain projected over the next two weeks.
Nearby streamflow gauges
USGS streamgauges around Green Valley Park -- inflows here typically show up in storage 24-72 hours later.
| Streamgauge | Discharge | View |
|---|---|---|
| East Verde R Div From East Clear Cr Nr Pine | 3 cfs | → |
| East Verde River Near Childs | · | → |
| Tonto Creek Abv Gun Creek | 7 cfs | → |
| Wet Bottom Creek Near Childs | 1 cfs | → |
| Verde R Blw Tangle Creek | 165 cfs | → |
| West Clear Creek Near Camp Verde | 13 cfs | → |
Make a day of it
Boat launches, lakeside camping, fishing access, and other reservoirs near Green Valley Park.
Boat launches
See all →


Campgrounds
See all →


Fishing spots
See all →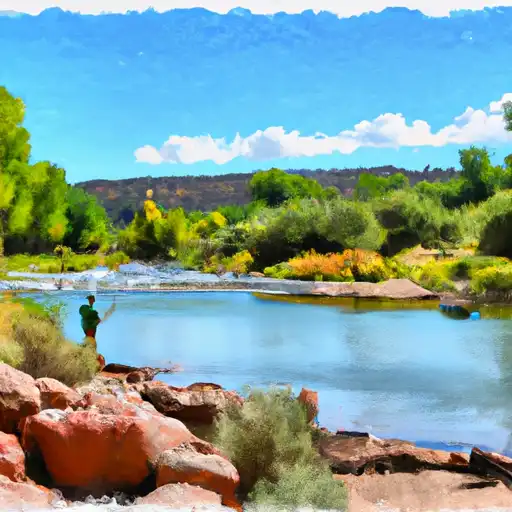


River runs
See all →


About Green Valley Park
Where does the data for Green Valley Park come from?
Structural and regulatory data come from the U.S. Army Corps of Engineers' National Inventory of Dams (NID). Weather forecast comes from NOAA / yr.no -- the same feed Snoflo's iOS app uses.
How often is the report updated?
NID structural data refreshes annually as the Corps publishes updated assessments. The weather forecast refreshes throughout the day.
What does the High hazard rating mean?
The Corps of Engineers' hazard potential classification grades probable consequences if the dam fails: High = probable loss of human life; Significant = no probable loss of human life but possible economic loss / environmental damage; Low = no probable loss of human life, only minor economic / environmental losses. See the Dam Data Reference card below for the full definitions.
What's "% of normal"?
The current storage value compared to the historical average storage on this calendar day. 100% = right on average; values above 100% mean above-normal storage (wet year); values below mean below-normal (dry year or drought).
Can I get alerts when storage crosses a threshold?
Yes -- alerts are managed in the Snoflo iOS app. Favorite this dam, set a threshold, and you'll get a push the moment conditions cross.
Dam data reference
Condition Assessment
- Satisfactory
- No existing or potential dam safety deficiencies are recognized. Acceptable performance is expected under all loading conditions (static, hydrologic, seismic) in accordance with the minimum applicable state or federal regulatory criteria or tolerable risk guidelines.
- Fair
- No existing dam safety deficiencies are recognized for normal operating conditions. Rare or extreme hydrologic and/or seismic events may result in a dam safety deficiency. Risk may be in the range to take further action.
- Poor
- A dam safety deficiency is recognized for normal operating conditions which may realistically occur. Remedial action is necessary. POOR may also be used when uncertainties exist as to critical analysis parameters which identify a potential dam safety deficiency.
- Unsatisfactory
- A dam safety deficiency is recognized that requires immediate or emergency remedial action for problem resolution.
- Not Rated
- The dam has not been inspected, is not under state or federal jurisdiction, or has been inspected but, for whatever reason, has not been rated.
Hazard Potential Classification
- High
- Dams assigned the high hazard potential classification are those where failure or mis-operation will probably cause loss of human life.
- Significant
- Dams assigned the significant hazard potential classification are those dams where failure or mis-operation results in no probable loss of human life but can cause economic loss, environmental damage, disruption of lifeline facilities, or impact other concerns. Significant hazard potential classification dams are often located in predominantly rural or agricultural areas but could be in areas with population and significant infrastructure.
- Low
- Dams assigned the low hazard potential classification are those where failure or mis-operation results in no probable loss of human life and low economic and/or environmental losses. Losses are principally limited to the owner's property.
- Undetermined
- Dams for which a downstream hazard potential has not been designated or is not provided.