Big Santa Anita Dam

Big Santa Anita
Big Santa Anita is a crucial dam located in Sierra Madre, California, serving as a vital component for flood risk reduction, irrigation, and water supply in the region. Built in 1927, this arch-type dam stands at a height of 225 feet, with a hydraulic height of 127 feet and a length of 612 feet, providing a storage capacity of 858 acre-feet. Situated on the Tr Rio Hondo river, the dam covers a surface area of 5 acres and drains a watershed area of 10.8 square miles, making it a significant structure in managing water resources in Los Angeles County.
Despite its age, the dam is in satisfactory condition according to a 2017 assessment, with a high hazard potential due to its critical role in flood risk reduction. The dam is under the jurisdiction of the California Department of Water Resources and is subject to regular inspections, permitting, and enforcement to ensure its structural integrity and safety. The surrounding community relies on Big Santa Anita for protection against flooding events and as a vital source of water for irrigation and supply, highlighting the importance of maintaining and monitoring this key infrastructure in the face of changing climate conditions.
With a history of serving the local community for over nine decades, Big Santa Anita continues to play a vital role in water resource management and climate resilience efforts in Southern California. As climate change brings about more frequent and intense weather events, the dam's role in flood risk reduction becomes increasingly crucial. By ensuring the ongoing maintenance and monitoring of this essential infrastructure, stakeholders can better prepare for and mitigate the impacts of extreme weather events, safeguarding both lives and property in the region.
Plan around the weather
Same NOAA / yr.no feed Snoflo's iOS app uses. Watch the precipitation column on the meteogram -- rain on the basin upstream typically lifts inflow 24-72 hours later.
Next 5 days, hour by hour
Temperature line with weather symbols on top, snow + rain accumulation as columns, humidity as a dotted line.
5-day forecast table
Every 3 hours, broken out across temperature, snow, rain, humidity, and wind. Each cell is colour-coded relative to the column min/max.
| Time | Condition | Temp (°F) | Snow (in) | Rain (in) | Humidity (%) | Wind (mps) | Wind dir |
|---|---|---|---|---|---|---|---|
| Loading detailed forecast… | |||||||
15-day temperature & precipitation
Daily temperatures, snow, and rain projected over the next two weeks.
Nearby streamflow gauges
USGS streamgauges around Big Santa Anita -- inflows here typically show up in storage 24-72 hours later.
| Streamgauge | Discharge | View |
|---|---|---|
| San Gabriel R Bl Santa Fe Dam Nr Baldwin Pk Ca | · | → |
| Rio Hondo Ab Whittier Narrows Dam Ca | 1 cfs | → |
| Arroyo Seco Nr Pasadena Ca | 1 cfs | → |
| San Gabriel R Ab Whittier Narrows Dam Ca | 0 cfs | → |
| Rio Hondo Bl Whittier Narrows Dam Ca | · | → |
| Big Rock C Nr Valyermo Ca | 13 cfs | → |
Make a day of it
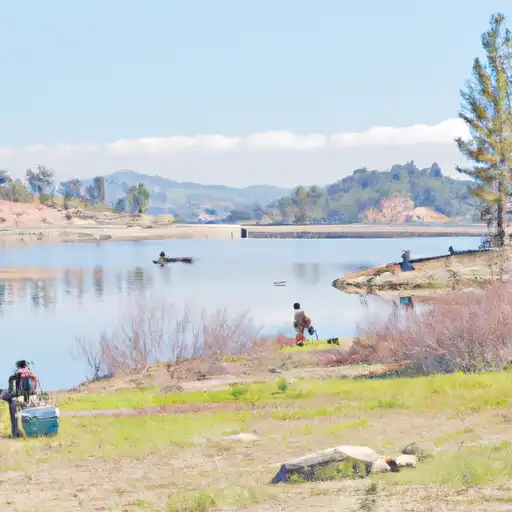
Boat launches, lakeside camping, fishing access, and other reservoirs near Big Santa Anita.
Boat launches
See all →


Campgrounds
See all →


Fishing spots
See all →


River runs
See all →


About Big Santa Anita
Where does the data for Big Santa Anita come from?
Structural and regulatory data come from the U.S. Army Corps of Engineers' National Inventory of Dams (NID). Weather forecast comes from NOAA / yr.no -- the same feed Snoflo's iOS app uses.
How often is the report updated?
NID structural data refreshes annually as the Corps publishes updated assessments. The weather forecast refreshes throughout the day.
What does the High hazard rating mean?
The Corps of Engineers' hazard potential classification grades probable consequences if the dam fails: High = probable loss of human life; Significant = no probable loss of human life but possible economic loss / environmental damage; Low = no probable loss of human life, only minor economic / environmental losses. See the Dam Data Reference card below for the full definitions.
What's "% of normal"?
The current storage value compared to the historical average storage on this calendar day. 100% = right on average; values above 100% mean above-normal storage (wet year); values below mean below-normal (dry year or drought).
Can I get alerts when storage crosses a threshold?
Yes -- alerts are managed in the Snoflo iOS app. Favorite this dam, set a threshold, and you'll get a push the moment conditions cross.
Dam data reference
Condition Assessment
- Satisfactory
- No existing or potential dam safety deficiencies are recognized. Acceptable performance is expected under all loading conditions (static, hydrologic, seismic) in accordance with the minimum applicable state or federal regulatory criteria or tolerable risk guidelines.
- Fair
- No existing dam safety deficiencies are recognized for normal operating conditions. Rare or extreme hydrologic and/or seismic events may result in a dam safety deficiency. Risk may be in the range to take further action.
- Poor
- A dam safety deficiency is recognized for normal operating conditions which may realistically occur. Remedial action is necessary. POOR may also be used when uncertainties exist as to critical analysis parameters which identify a potential dam safety deficiency.
- Unsatisfactory
- A dam safety deficiency is recognized that requires immediate or emergency remedial action for problem resolution.
- Not Rated
- The dam has not been inspected, is not under state or federal jurisdiction, or has been inspected but, for whatever reason, has not been rated.
Hazard Potential Classification
- High
- Dams assigned the high hazard potential classification are those where failure or mis-operation will probably cause loss of human life.
- Significant
- Dams assigned the significant hazard potential classification are those dams where failure or mis-operation results in no probable loss of human life but can cause economic loss, environmental damage, disruption of lifeline facilities, or impact other concerns. Significant hazard potential classification dams are often located in predominantly rural or agricultural areas but could be in areas with population and significant infrastructure.
- Low
- Dams assigned the low hazard potential classification are those where failure or mis-operation results in no probable loss of human life and low economic and/or environmental losses. Losses are principally limited to the owner's property.
- Undetermined
- Dams for which a downstream hazard potential has not been designated or is not provided.