San Joaquin No. 3 Forebay Dam

San Joaquin No. 3 Forebay
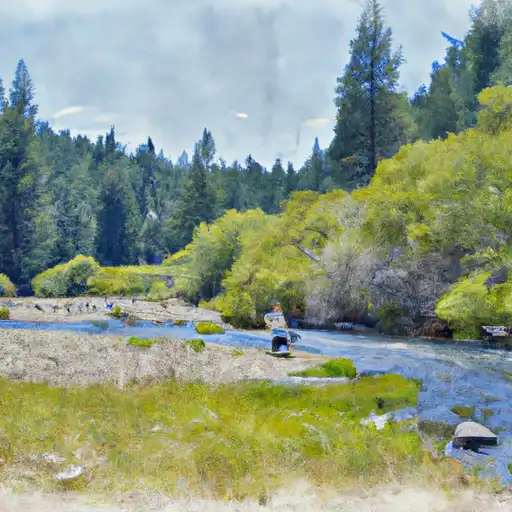
San Joaquin No. 3 Forebay, located in North Fork, California, is a privately owned structure primarily used for hydroelectric purposes. This Earth dam, completed in 1906, stands at a height of 40 feet with a hydraulic height of 7 feet. With a storage capacity of 20 acre-feet and a normal storage level of 19 acre-feet, the forebay covers a surface area of 3 acres and has a maximum discharge capacity of 170 cubic feet per second.
Managed by the Federal Energy Regulatory Commission, the dam's hazard potential is classified as low, with a moderate risk assessment rating of 3. The structure features an uncontrolled spillway, 42 feet in width, and is subject to state regulations, inspections, and enforcement. Although the condition assessment is not currently available, the Emergency Action Plan was last revised in October 2020, ensuring preparedness for any unforeseen events.
With its historical significance dating back over a century, the San Joaquin No. 3 Forebay serves as a vital component in the region's water resource management and climate resilience efforts. Its strategic location on the North Fork Willow Creek contributes to the overall water infrastructure system in Madera County, playing a crucial role in supporting renewable energy production and environmental sustainability initiatives. As a part of ongoing maintenance and risk management measures, the forebay continues to be monitored and regulated by both state and federal agencies to ensure the safety and integrity of the dam for years to come.
Plan around the weather
Same NOAA / yr.no feed Snoflo's iOS app uses. Watch the precipitation column on the meteogram -- rain on the basin upstream typically lifts inflow 24-72 hours later.
Next 5 days, hour by hour
Temperature line with weather symbols on top, snow + rain accumulation as columns, humidity as a dotted line.
5-day forecast table
Every 3 hours, broken out across temperature, snow, rain, humidity, and wind. Each cell is colour-coded relative to the column min/max.
| Time | Condition | Temp (°F) | Snow (in) | Rain (in) | Humidity (%) | Wind (mps) | Wind dir |
|---|---|---|---|---|---|---|---|
| Loading detailed forecast… | |||||||
15-day temperature & precipitation
Daily temperatures, snow, and rain projected over the next two weeks.
Nearby streamflow gauges
USGS streamgauges around San Joaquin No. 3 Forebay -- inflows here typically show up in storage 24-72 hours later.
| Streamgauge | Discharge | View |
|---|---|---|
| Nf Willow C Nr Sugar Pine Ca | 416 cfs | → |
| Big C Div Nr Fish Camp Ca | 0 cfs | → |
| San Joaquin R Bl Friant Ca | 325 cfs | → |
| Merced R A Pohono Bridge Nr Yosemite Ca | 128 cfs | → |
| Merced R A Happy Isles Bridge Nr Yosemite Ca | 97 cfs | → |
| Mf San Joaquin R Nr Mammoth Lakes Ca | 66 cfs | → |
Make a day of it
Boat launches, lakeside camping, fishing access, and other reservoirs near San Joaquin No. 3 Forebay .
Boat launches
See all →


Campgrounds
See all →


Fishing spots
See all →


River runs
See all →


About San Joaquin No. 3 Forebay
Where does the data for San Joaquin No. 3 Forebay come from?
Structural and regulatory data come from the U.S. Army Corps of Engineers' National Inventory of Dams (NID). Weather forecast comes from NOAA / yr.no -- the same feed Snoflo's iOS app uses.
How often is the report updated?
NID structural data refreshes annually as the Corps publishes updated assessments. The weather forecast refreshes throughout the day.
What does the Low hazard rating mean?
The Corps of Engineers' hazard potential classification grades probable consequences if the dam fails: High = probable loss of human life; Significant = no probable loss of human life but possible economic loss / environmental damage; Low = no probable loss of human life, only minor economic / environmental losses. See the Dam Data Reference card below for the full definitions.
What's "% of normal"?
The current storage value compared to the historical average storage on this calendar day. 100% = right on average; values above 100% mean above-normal storage (wet year); values below mean below-normal (dry year or drought).
Can I get alerts when storage crosses a threshold?
Yes -- alerts are managed in the Snoflo iOS app. Favorite this dam, set a threshold, and you'll get a push the moment conditions cross.
Dam data reference
Condition Assessment
- Satisfactory
- No existing or potential dam safety deficiencies are recognized. Acceptable performance is expected under all loading conditions (static, hydrologic, seismic) in accordance with the minimum applicable state or federal regulatory criteria or tolerable risk guidelines.
- Fair
- No existing dam safety deficiencies are recognized for normal operating conditions. Rare or extreme hydrologic and/or seismic events may result in a dam safety deficiency. Risk may be in the range to take further action.
- Poor
- A dam safety deficiency is recognized for normal operating conditions which may realistically occur. Remedial action is necessary. POOR may also be used when uncertainties exist as to critical analysis parameters which identify a potential dam safety deficiency.
- Unsatisfactory
- A dam safety deficiency is recognized that requires immediate or emergency remedial action for problem resolution.
- Not Rated
- The dam has not been inspected, is not under state or federal jurisdiction, or has been inspected but, for whatever reason, has not been rated.
Hazard Potential Classification
- High
- Dams assigned the high hazard potential classification are those where failure or mis-operation will probably cause loss of human life.
- Significant
- Dams assigned the significant hazard potential classification are those dams where failure or mis-operation results in no probable loss of human life but can cause economic loss, environmental damage, disruption of lifeline facilities, or impact other concerns. Significant hazard potential classification dams are often located in predominantly rural or agricultural areas but could be in areas with population and significant infrastructure.
- Low
- Dams assigned the low hazard potential classification are those where failure or mis-operation results in no probable loss of human life and low economic and/or environmental losses. Losses are principally limited to the owner's property.
- Undetermined
- Dams for which a downstream hazard potential has not been designated or is not provided.