Martis Creek Dam Dam

Martis Creek Dam
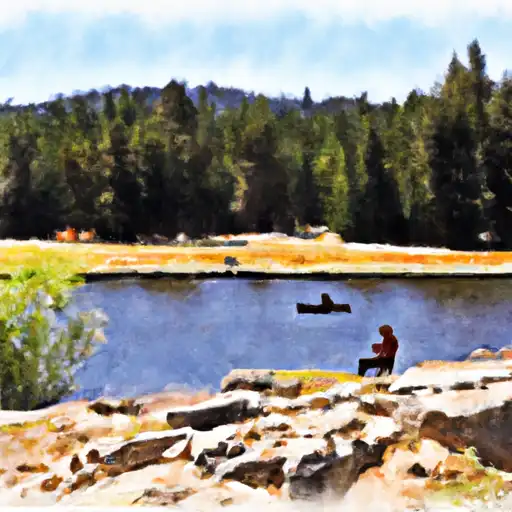
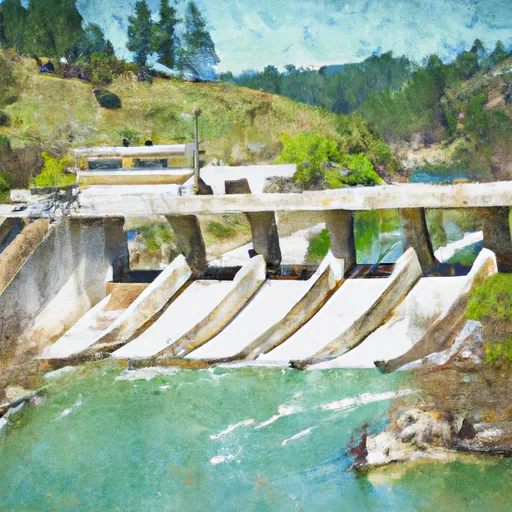
Martis Creek Dam, also known as Martis Creek Lake, is a federal-owned structure located in Nevada County, California. Completed in 1972, this earth dam serves primarily for flood risk reduction but also supports hydroelectric power generation and recreational activities. Standing at 93 feet tall with a hydraulic height of 108 feet, the dam has a storage capacity of 22,000 acre-feet and a maximum discharge of 4,060 cubic feet per second.
Despite a history of water seepage issues, Martis Creek Dam has undergone significant modifications to improve its performance and reduce risks. Recent risk assessments have categorized the dam as having a moderate risk level, with measures in place to prevent water seepage and overtopping. The US Army Corps of Engineers (USACE) actively manages the dam, working with local emergency managers, updating emergency action plans, and conducting regular maintenance and inspections to ensure public safety. While concerns remain about potential dam failure scenarios, the implementation of risk reduction measures and emergency preparedness plans help mitigate these risks and protect downstream communities.
Plan around the weather
Same NOAA / yr.no feed Snoflo's iOS app uses. Watch the precipitation column on the meteogram -- rain on the basin upstream typically lifts inflow 24-72 hours later.
Next 5 days, hour by hour
Temperature line with weather symbols on top, snow + rain accumulation as columns, humidity as a dotted line.
5-day forecast table
Every 3 hours, broken out across temperature, snow, rain, humidity, and wind. Each cell is colour-coded relative to the column min/max.
| Time | Condition | Temp (°F) | Snow (in) | Rain (in) | Humidity (%) | Wind (mps) | Wind dir |
|---|---|---|---|---|---|---|---|
| Loading detailed forecast… | |||||||
15-day temperature & precipitation
Daily temperatures, snow, and rain projected over the next two weeks.
Nearby streamflow gauges
USGS streamgauges around Martis Creek Dam -- inflows here typically show up in storage 24-72 hours later.
| Streamgauge | Discharge | View |
|---|---|---|
| Truckee R Bl Martis C Nr Truckee Ca | 295 cfs | → |
| Prosser C Bl Prosser C Dam Nr Truckee Ca | 43 cfs | → |
| Little Truckee R Bl Boca Dam Nr Truckee Ca | 149 cfs | → |
| Truckee R A Boca Bridge Nr Truckee Ca | 484 cfs | → |
| Donner C At Hwy 89 Nr Truckee Ca | 7 cfs | → |
| Truckee R Nr Truckee Ca | 278 cfs | → |


About Martis Creek Dam
Where does the data for Martis Creek Dam come from?
Structural and regulatory data come from the U.S. Army Corps of Engineers' National Inventory of Dams (NID). Weather forecast comes from NOAA / yr.no -- the same feed Snoflo's iOS app uses.
How often is the report updated?
NID structural data refreshes annually as the Corps publishes updated assessments. The weather forecast refreshes throughout the day.
What does the High hazard rating mean?
The Corps of Engineers' hazard potential classification grades probable consequences if the dam fails: High = probable loss of human life; Significant = no probable loss of human life but possible economic loss / environmental damage; Low = no probable loss of human life, only minor economic / environmental losses. See the Dam Data Reference card below for the full definitions.
What's "% of normal"?
The current storage value compared to the historical average storage on this calendar day. 100% = right on average; values above 100% mean above-normal storage (wet year); values below mean below-normal (dry year or drought).
Can I get alerts when storage crosses a threshold?
Yes -- alerts are managed in the Snoflo iOS app. Favorite this dam, set a threshold, and you'll get a push the moment conditions cross.
Dam data reference
Condition Assessment
- Satisfactory
- No existing or potential dam safety deficiencies are recognized. Acceptable performance is expected under all loading conditions (static, hydrologic, seismic) in accordance with the minimum applicable state or federal regulatory criteria or tolerable risk guidelines.
- Fair
- No existing dam safety deficiencies are recognized for normal operating conditions. Rare or extreme hydrologic and/or seismic events may result in a dam safety deficiency. Risk may be in the range to take further action.
- Poor
- A dam safety deficiency is recognized for normal operating conditions which may realistically occur. Remedial action is necessary. POOR may also be used when uncertainties exist as to critical analysis parameters which identify a potential dam safety deficiency.
- Unsatisfactory
- A dam safety deficiency is recognized that requires immediate or emergency remedial action for problem resolution.
- Not Rated
- The dam has not been inspected, is not under state or federal jurisdiction, or has been inspected but, for whatever reason, has not been rated.
Hazard Potential Classification
- High
- Dams assigned the high hazard potential classification are those where failure or mis-operation will probably cause loss of human life.
- Significant
- Dams assigned the significant hazard potential classification are those dams where failure or mis-operation results in no probable loss of human life but can cause economic loss, environmental damage, disruption of lifeline facilities, or impact other concerns. Significant hazard potential classification dams are often located in predominantly rural or agricultural areas but could be in areas with population and significant infrastructure.
- Low
- Dams assigned the low hazard potential classification are those where failure or mis-operation results in no probable loss of human life and low economic and/or environmental losses. Losses are principally limited to the owner's property.
- Undetermined
- Dams for which a downstream hazard potential has not been designated or is not provided.