W. W. Jones Dam Dam

W. W. Jones Dam
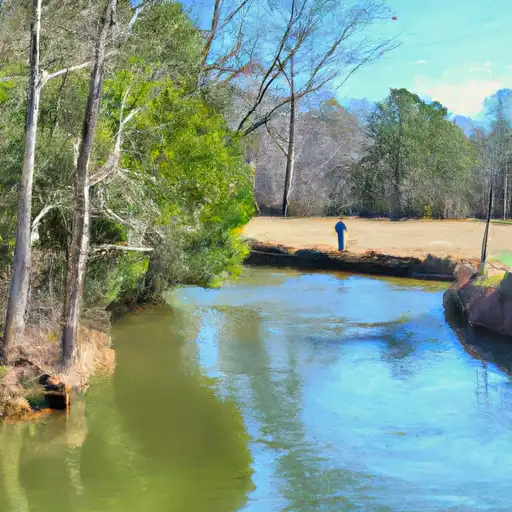
W. W. Jones Dam, located in Spindale, North Carolina, is a private-owned earth dam primarily used for recreation on Gilkey Creek. Built by the USDA NRCS, this dam has a hydraulic height of 23.5 feet and a structural height of 27.5 feet, with a total length of 205 feet. It has a maximum storage capacity of 34 acre-feet and a normal storage capacity of 28 acre-feet, covering a surface area of 3 acres.
Despite its significant hazard potential and poor condition assessment, W. W. Jones Dam has been inspected and maintained by the state, with the last inspection conducted in April 2014. This dam features an uncontrolled spillway and outlet gates, posing moderate risk according to the risk assessment. While there are no associated structures, this dam serves as a recreational area for water resource and climate enthusiasts in Rutherford County, North Carolina.
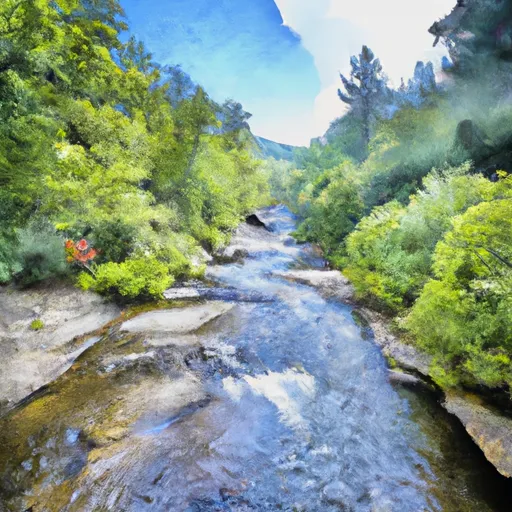
With its serene surroundings and recreational amenities, W. W. Jones Dam offers a picturesque setting for visitors to enjoy water activities on Gilkey Creek. Although the dam's condition may warrant improvements, its historical significance and natural beauty make it a popular destination for outdoor enthusiasts seeking a peaceful retreat in the heart of North Carolina.
Plan around the weather
Same NOAA / yr.no feed Snoflo's iOS app uses. Watch the precipitation column on the meteogram -- rain on the basin upstream typically lifts inflow 24-72 hours later.
Next 5 days, hour by hour
Temperature line with weather symbols on top, snow + rain accumulation as columns, humidity as a dotted line.
5-day forecast table
Every 3 hours, broken out across temperature, snow, rain, humidity, and wind. Each cell is colour-coded relative to the column min/max.
| Time | Condition | Temp (°F) | Snow (in) | Rain (in) | Humidity (%) | Wind (mps) | Wind dir |
|---|---|---|---|---|---|---|---|
| Loading detailed forecast… | |||||||
15-day temperature & precipitation
Daily temperatures, snow, and rain projected over the next two weeks.
Nearby streamflow gauges
USGS streamgauges around W. W. Jones Dam -- inflows here typically show up in storage 24-72 hours later.
| Streamgauge | Discharge | View |
|---|---|---|
| Cove Creek Near Lake Lure | 103 cfs | → |
| Second Broad River Nr Logan | 74 cfs | → |
| Catawba R Nr Pleasant Gardens | 145 cfs | → |
| First Broad River Near Casar | 33 cfs | → |
| Linville River Near Nebo | 173 cfs | → |
| North Fork Swannanoa River Near Walkertown | 25 cfs | → |
Make a day of it
Boat launches, lakeside camping, fishing access, and other reservoirs near W. W. Jones Dam.
Boat launches
See all →


Campgrounds
See all →


Fishing spots
See all →


River runs
See all →


About W. W. Jones Dam
Where does the data for W. W. Jones Dam come from?
Structural and regulatory data come from the U.S. Army Corps of Engineers' National Inventory of Dams (NID). Weather forecast comes from NOAA / yr.no -- the same feed Snoflo's iOS app uses.
How often is the report updated?
NID structural data refreshes annually as the Corps publishes updated assessments. The weather forecast refreshes throughout the day.
What does the Significant hazard rating mean?
The Corps of Engineers' hazard potential classification grades probable consequences if the dam fails: High = probable loss of human life; Significant = no probable loss of human life but possible economic loss / environmental damage; Low = no probable loss of human life, only minor economic / environmental losses. See the Dam Data Reference card below for the full definitions.
What's "% of normal"?
The current storage value compared to the historical average storage on this calendar day. 100% = right on average; values above 100% mean above-normal storage (wet year); values below mean below-normal (dry year or drought).
Can I get alerts when storage crosses a threshold?
Yes -- alerts are managed in the Snoflo iOS app. Favorite this dam, set a threshold, and you'll get a push the moment conditions cross.
Dam data reference
Condition Assessment
- Satisfactory
- No existing or potential dam safety deficiencies are recognized. Acceptable performance is expected under all loading conditions (static, hydrologic, seismic) in accordance with the minimum applicable state or federal regulatory criteria or tolerable risk guidelines.
- Fair
- No existing dam safety deficiencies are recognized for normal operating conditions. Rare or extreme hydrologic and/or seismic events may result in a dam safety deficiency. Risk may be in the range to take further action.
- Poor
- A dam safety deficiency is recognized for normal operating conditions which may realistically occur. Remedial action is necessary. POOR may also be used when uncertainties exist as to critical analysis parameters which identify a potential dam safety deficiency.
- Unsatisfactory
- A dam safety deficiency is recognized that requires immediate or emergency remedial action for problem resolution.
- Not Rated
- The dam has not been inspected, is not under state or federal jurisdiction, or has been inspected but, for whatever reason, has not been rated.
Hazard Potential Classification
- High
- Dams assigned the high hazard potential classification are those where failure or mis-operation will probably cause loss of human life.
- Significant
- Dams assigned the significant hazard potential classification are those dams where failure or mis-operation results in no probable loss of human life but can cause economic loss, environmental damage, disruption of lifeline facilities, or impact other concerns. Significant hazard potential classification dams are often located in predominantly rural or agricultural areas but could be in areas with population and significant infrastructure.
- Low
- Dams assigned the low hazard potential classification are those where failure or mis-operation results in no probable loss of human life and low economic and/or environmental losses. Losses are principally limited to the owner's property.
- Undetermined
- Dams for which a downstream hazard potential has not been designated or is not provided.