Upper Of Lower Canjilon Lake Dam Dam

Upper Of Lower Canjilon Lake Dam
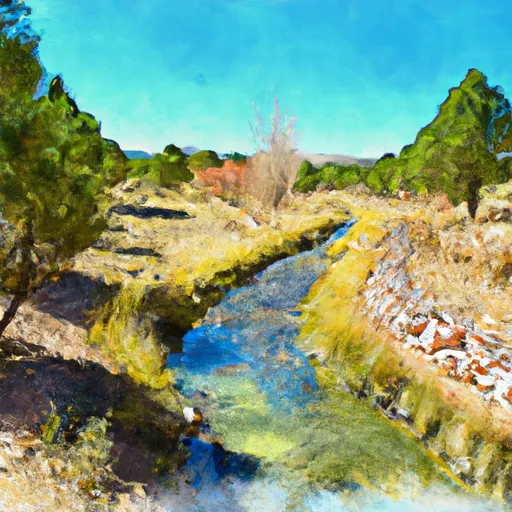
Located in Rio Arriba, New Mexico, the Upper of Lower Canjilon Lake Dam is a Federal-owned structure managed by the USDA Forest Service. Built in 1948, this earth dam stands at a height of 10 feet and serves primarily for recreation purposes, including fish and wildlife pond activities. With a maximum storage capacity of 20 acre-feet, the dam also features an uncontrolled spillway with a width of 150 feet.
Despite its small size, the dam poses a significant hazard potential and is classified as having a moderate risk level. Although it has not been rated for its condition as of yet, the last inspection conducted in 2009 revealed no major issues. The dam is not under state regulation and does not have an Emergency Action Plan in place, indicating a need for further risk management measures to be implemented in the future.
For water resource and climate enthusiasts, the Upper of Lower Canjilon Lake Dam presents an interesting case study in dam management and risk assessment. As a key recreational structure in the area, efforts should be made to ensure its safety and functionality, especially given its potential impact on the surrounding environment. With a focus on maintaining and improving its infrastructure, the dam can continue to provide valuable services while minimizing potential hazards to the community.
Plan around the weather
Same NOAA / yr.no feed Snoflo's iOS app uses. Watch the precipitation column on the meteogram -- rain on the basin upstream typically lifts inflow 24-72 hours later.
Next 5 days, hour by hour
Temperature line with weather symbols on top, snow + rain accumulation as columns, humidity as a dotted line.
5-day forecast table
Every 3 hours, broken out across temperature, snow, rain, humidity, and wind. Each cell is colour-coded relative to the column min/max.
| Time | Condition | Temp (°F) | Snow (in) | Rain (in) | Humidity (%) | Wind (mps) | Wind dir |
|---|---|---|---|---|---|---|---|
| Loading detailed forecast… | |||||||
15-day temperature & precipitation
Daily temperatures, snow, and rain projected over the next two weeks.
Nearby streamflow gauges
USGS streamgauges around Upper Of Lower Canjilon Lake Dam -- inflows here typically show up in storage 24-72 hours later.
| Streamgauge | Discharge | View |
|---|---|---|
| Rio Chama Near La Puente | 29 cfs | → |
| Rio Ojo Caliente At La Madera | 4 cfs | → |
| Rio Chama Below El Vado Dam | 489 cfs | → |
| Rio Chama Above Abiquiu Reservoir | 469 cfs | → |
| Rio Chama Below Abiquiu Dam | 170 cfs | → |
| Rio Grande At Embudo | 152 cfs | → |


About Upper Of Lower Canjilon Lake Dam
Where does the data for Upper Of Lower Canjilon Lake Dam come from?
Structural and regulatory data come from the U.S. Army Corps of Engineers' National Inventory of Dams (NID). Weather forecast comes from NOAA / yr.no -- the same feed Snoflo's iOS app uses.
How often is the report updated?
NID structural data refreshes annually as the Corps publishes updated assessments. The weather forecast refreshes throughout the day.
What does the Significant hazard rating mean?
The Corps of Engineers' hazard potential classification grades probable consequences if the dam fails: High = probable loss of human life; Significant = no probable loss of human life but possible economic loss / environmental damage; Low = no probable loss of human life, only minor economic / environmental losses. See the Dam Data Reference card below for the full definitions.
What's "% of normal"?
The current storage value compared to the historical average storage on this calendar day. 100% = right on average; values above 100% mean above-normal storage (wet year); values below mean below-normal (dry year or drought).
Can I get alerts when storage crosses a threshold?
Yes -- alerts are managed in the Snoflo iOS app. Favorite this dam, set a threshold, and you'll get a push the moment conditions cross.
Dam data reference
Condition Assessment
- Satisfactory
- No existing or potential dam safety deficiencies are recognized. Acceptable performance is expected under all loading conditions (static, hydrologic, seismic) in accordance with the minimum applicable state or federal regulatory criteria or tolerable risk guidelines.
- Fair
- No existing dam safety deficiencies are recognized for normal operating conditions. Rare or extreme hydrologic and/or seismic events may result in a dam safety deficiency. Risk may be in the range to take further action.
- Poor
- A dam safety deficiency is recognized for normal operating conditions which may realistically occur. Remedial action is necessary. POOR may also be used when uncertainties exist as to critical analysis parameters which identify a potential dam safety deficiency.
- Unsatisfactory
- A dam safety deficiency is recognized that requires immediate or emergency remedial action for problem resolution.
- Not Rated
- The dam has not been inspected, is not under state or federal jurisdiction, or has been inspected but, for whatever reason, has not been rated.
Hazard Potential Classification
- High
- Dams assigned the high hazard potential classification are those where failure or mis-operation will probably cause loss of human life.
- Significant
- Dams assigned the significant hazard potential classification are those dams where failure or mis-operation results in no probable loss of human life but can cause economic loss, environmental damage, disruption of lifeline facilities, or impact other concerns. Significant hazard potential classification dams are often located in predominantly rural or agricultural areas but could be in areas with population and significant infrastructure.
- Low
- Dams assigned the low hazard potential classification are those where failure or mis-operation results in no probable loss of human life and low economic and/or environmental losses. Losses are principally limited to the owner's property.
- Undetermined
- Dams for which a downstream hazard potential has not been designated or is not provided.