Persimmon Creek dam

Persimmon Creek
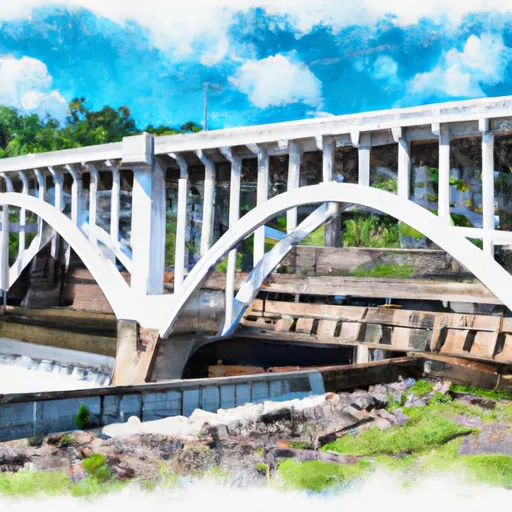
Located in Cherokee, North Carolina, Persimmon Creek, also known as Cherokee Lake, is a federal water resource managed by the USDA Forest Service. This concrete dam, completed in 1942, stands at 33 feet high and serves primarily for recreation purposes, including fish and wildlife pond activities. With a storage capacity of 1140 acre-feet and a surface area of 50 acres, Persimmon Creek offers a tranquil and picturesque setting for visitors to enjoy.
The dam's low hazard potential and moderate risk assessment make Persimmon Creek a relatively safe and well-maintained structure. While it is regulated and inspected by the North Carolina Department of Environmental Quality, Forest Service operations ensure the dam's continued functionality and safety. With its uncontrolled spillway, the dam has a maximum discharge capacity of 14000 cubic feet per second, ensuring efficient water management during high-flow events.
Persimmon Creek's scenic location, recreational amenities, and commitment to safety and regulatory compliance make it a valuable water resource in the region. Climate and water resource enthusiasts will appreciate the blend of natural beauty and engineering prowess that this federal dam on PERSIMMON CREEK offers to visitors and the local community.
Plan around the weather
Same NOAA / yr.no feed Snoflo's iOS app uses. Watch the precipitation column on the meteogram -- rain on the basin upstream typically lifts inflow 24-72 hours later.
Next 5 days, hour by hour
Temperature line with weather symbols on top, snow + rain accumulation as columns, humidity as a dotted line.
5-day forecast table
Every 3 hours, broken out across temperature, snow, rain, humidity, and wind. Each cell is colour-coded relative to the column min/max.
| Time | Condition | Temp (°F) | Snow (in) | Rain (in) | Humidity (%) | Wind (mps) | Wind dir |
|---|---|---|---|---|---|---|---|
| Loading detailed forecast… | |||||||
15-day temperature & precipitation
Daily temperatures, snow, and rain projected over the next two weeks.
Nearby streamflow gauges
USGS streamgauges around Persimmon Creek -- inflows here typically show up in storage 24-72 hours later.
| Streamgauge | Discharge | View |
|---|---|---|
| Valley River At Tomotla | 212 cfs | → |
| Ocoee River At Copperhill | 760 cfs | → |
| Toccoa River Near Dial | 262 cfs | → |
| Nottely River Near Blairsville | 81 cfs | → |
| Tellico River At Tellico Plains | 237 cfs | → |
| Cheoah River Nr Bearpen Gap Nr Tapoco | 122 cfs | → |


About Persimmon Creek
Where does the data for Persimmon Creek come from?
Structural and regulatory data come from the U.S. Army Corps of Engineers' National Inventory of Dams (NID). Weather forecast comes from NOAA / yr.no -- the same feed Snoflo's iOS app uses.
How often is the report updated?
NID structural data refreshes annually as the Corps publishes updated assessments. The weather forecast refreshes throughout the day.
What does the Low hazard rating mean?
The Corps of Engineers' hazard potential classification grades probable consequences if the dam fails: High = probable loss of human life; Significant = no probable loss of human life but possible economic loss / environmental damage; Low = no probable loss of human life, only minor economic / environmental losses. See the Dam Data Reference card below for the full definitions.
What's "% of normal"?
The current storage value compared to the historical average storage on this calendar day. 100% = right on average; values above 100% mean above-normal storage (wet year); values below mean below-normal (dry year or drought).
Can I get alerts when storage crosses a threshold?
Yes -- alerts are managed in the Snoflo iOS app. Favorite this dam, set a threshold, and you'll get a push the moment conditions cross.
Dam data reference
Condition Assessment
- Satisfactory
- No existing or potential dam safety deficiencies are recognized. Acceptable performance is expected under all loading conditions (static, hydrologic, seismic) in accordance with the minimum applicable state or federal regulatory criteria or tolerable risk guidelines.
- Fair
- No existing dam safety deficiencies are recognized for normal operating conditions. Rare or extreme hydrologic and/or seismic events may result in a dam safety deficiency. Risk may be in the range to take further action.
- Poor
- A dam safety deficiency is recognized for normal operating conditions which may realistically occur. Remedial action is necessary. POOR may also be used when uncertainties exist as to critical analysis parameters which identify a potential dam safety deficiency.
- Unsatisfactory
- A dam safety deficiency is recognized that requires immediate or emergency remedial action for problem resolution.
- Not Rated
- The dam has not been inspected, is not under state or federal jurisdiction, or has been inspected but, for whatever reason, has not been rated.
Hazard Potential Classification
- High
- Dams assigned the high hazard potential classification are those where failure or mis-operation will probably cause loss of human life.
- Significant
- Dams assigned the significant hazard potential classification are those dams where failure or mis-operation results in no probable loss of human life but can cause economic loss, environmental damage, disruption of lifeline facilities, or impact other concerns. Significant hazard potential classification dams are often located in predominantly rural or agricultural areas but could be in areas with population and significant infrastructure.
- Low
- Dams assigned the low hazard potential classification are those where failure or mis-operation results in no probable loss of human life and low economic and/or environmental losses. Losses are principally limited to the owner's property.
- Undetermined
- Dams for which a downstream hazard potential has not been designated or is not provided.