Scales #1 (Lower) Dam

Scales #1 (Lower)
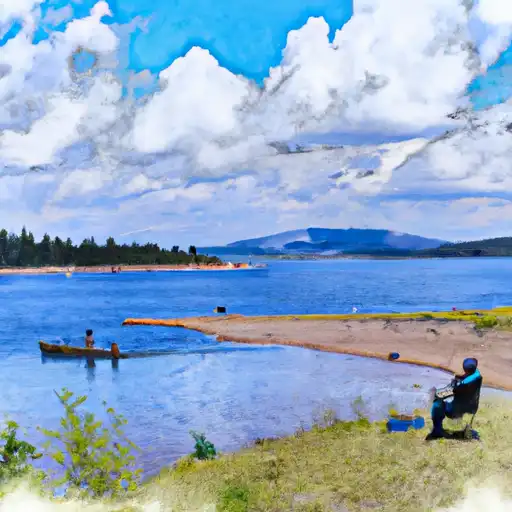
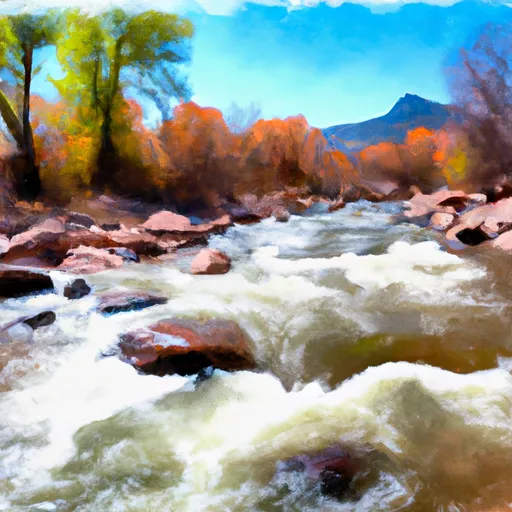
Scales #1 (Lower) is a privately owned irrigation dam located in Grand Junction, Colorado, along the KahNah Creek-TR. Built in 1959, this earth dam stands at a height of 10 feet and has a hydraulic height of 12 feet, with a length of 360 feet. The dam has a storage capacity of 479 acre-feet, with a normal storage level of 204 acre-feet and a surface area of 55 acres.
Despite being classified as having a low hazard potential and fair condition assessment, Scales #1 (Lower) is considered to have a high risk level, with a risk assessment rating of 2. The dam has uncontrolled and valve outlet gates, with a spillway width of 15 feet. The last inspection conducted on the dam was in July 2019, with an inspection frequency of every 6 years.
Water resource and climate enthusiasts interested in the infrastructure and management of irrigation systems in Colorado may find Scales #1 (Lower) to be a fascinating case study. The dam's role in regulating water flow for agricultural purposes, along with its risk assessment and condition evaluation, provide valuable insights into the challenges and considerations involved in maintaining and operating such critical water resource structures.
Plan around the weather
Same NOAA / yr.no feed Snoflo's iOS app uses. Watch the precipitation column on the meteogram -- rain on the basin upstream typically lifts inflow 24-72 hours later.
Next 5 days, hour by hour
Temperature line with weather symbols on top, snow + rain accumulation as columns, humidity as a dotted line.
5-day forecast table
Every 3 hours, broken out across temperature, snow, rain, humidity, and wind. Each cell is colour-coded relative to the column min/max.
| Time | Condition | Temp (°F) | Snow (in) | Rain (in) | Humidity (%) | Wind (mps) | Wind dir |
|---|---|---|---|---|---|---|---|
| Loading detailed forecast… | |||||||
15-day temperature & precipitation
Daily temperatures, snow, and rain projected over the next two weeks.
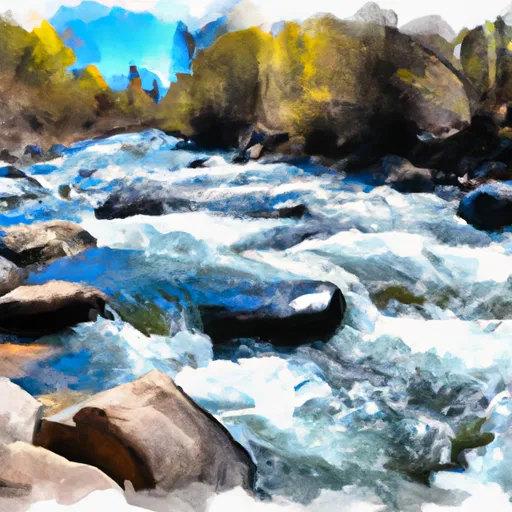
Nearby streamflow gauges
USGS streamgauges around Scales #1 (Lower) -- inflows here typically show up in storage 24-72 hours later.
| Streamgauge | Discharge | View |
|---|---|---|
| Big Creek At Upper Station | 5 cfs | → |
| Surface Creek Near Cedaredge | 31 cfs | → |
| Surface Creek At Cedaredge | 12 cfs | → |
| Plateau Creek Near Cameo | 17 cfs | → |
| Colo River Blw Grd Valley Div Nr Palisade Co | 294 cfs | → |
| Colorado River Near Cameo | 1,710 cfs | → |


About Scales #1 (Lower)
Where does the data for Scales #1 (Lower) come from?
Structural and regulatory data come from the U.S. Army Corps of Engineers' National Inventory of Dams (NID). Weather forecast comes from NOAA / yr.no -- the same feed Snoflo's iOS app uses.
How often is the report updated?
NID structural data refreshes annually as the Corps publishes updated assessments. The weather forecast refreshes throughout the day.
What does the Low hazard rating mean?
The Corps of Engineers' hazard potential classification grades probable consequences if the dam fails: High = probable loss of human life; Significant = no probable loss of human life but possible economic loss / environmental damage; Low = no probable loss of human life, only minor economic / environmental losses. See the Dam Data Reference card below for the full definitions.
What's "% of normal"?
The current storage value compared to the historical average storage on this calendar day. 100% = right on average; values above 100% mean above-normal storage (wet year); values below mean below-normal (dry year or drought).
Can I get alerts when storage crosses a threshold?
Yes -- alerts are managed in the Snoflo iOS app. Favorite this dam, set a threshold, and you'll get a push the moment conditions cross.
Dam data reference
Condition Assessment
- Satisfactory
- No existing or potential dam safety deficiencies are recognized. Acceptable performance is expected under all loading conditions (static, hydrologic, seismic) in accordance with the minimum applicable state or federal regulatory criteria or tolerable risk guidelines.
- Fair
- No existing dam safety deficiencies are recognized for normal operating conditions. Rare or extreme hydrologic and/or seismic events may result in a dam safety deficiency. Risk may be in the range to take further action.
- Poor
- A dam safety deficiency is recognized for normal operating conditions which may realistically occur. Remedial action is necessary. POOR may also be used when uncertainties exist as to critical analysis parameters which identify a potential dam safety deficiency.
- Unsatisfactory
- A dam safety deficiency is recognized that requires immediate or emergency remedial action for problem resolution.
- Not Rated
- The dam has not been inspected, is not under state or federal jurisdiction, or has been inspected but, for whatever reason, has not been rated.
Hazard Potential Classification
- High
- Dams assigned the high hazard potential classification are those where failure or mis-operation will probably cause loss of human life.
- Significant
- Dams assigned the significant hazard potential classification are those dams where failure or mis-operation results in no probable loss of human life but can cause economic loss, environmental damage, disruption of lifeline facilities, or impact other concerns. Significant hazard potential classification dams are often located in predominantly rural or agricultural areas but could be in areas with population and significant infrastructure.
- Low
- Dams assigned the low hazard potential classification are those where failure or mis-operation results in no probable loss of human life and low economic and/or environmental losses. Losses are principally limited to the owner's property.
- Undetermined
- Dams for which a downstream hazard potential has not been designated or is not provided.