

-
 Snoflo Premium
Get unlimited access to all our content
With no Ad interruptions! - Start Your Free Trial Login with existing account
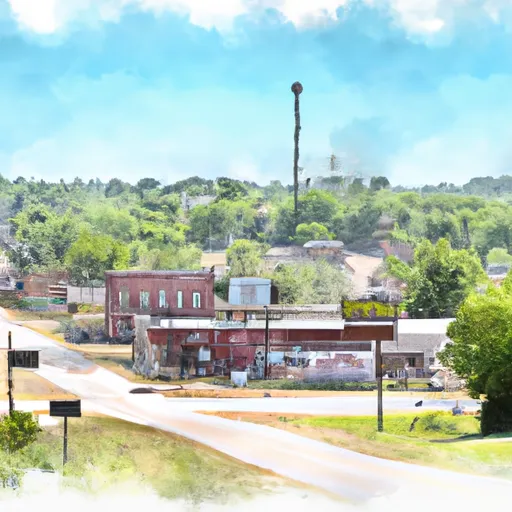
Piggott
Eden Index
Climate
8.1
•
Recreation
2.8
•
Community
1.0
•
Safeguard
4.5/10
What is the Eden Index?
The Snoflo Eden Index serves as a comprehensive rating system for regions, evaluating their desirability through a holistic assessment of climate health, outdoor recreation opportunities, and natural disaster risk, acknowledging the profound impact of these factors on livability and well-being.
Climate Health Indicator (CHI): 8.1
Piggott receives approximately
1198mm of rain per year,
with humidity levels near 84%
and air temperatures averaging around
15°C.
Piggott has a plant hardyness factor of
7, meaning
plants and agriculture in this region tend to thrive during the non-winter months.
By considering the ideal temperature range, reliable water supplies, clean air, and stable seasonal rain or snowpacks, the Climate Health Indicator (CHI) underscores the significance of a healthy climate as the foundation for quality living.
A healthy climate is paramount for ensuring a high quality of life and livability in a region, fostering both physical well-being and environmental harmony. This can be characterized by ideal temperatures, reliable access to water supplies, clean air, and consistent seasonal rain or snowpacks.
Weather Forecast
Streamflow Conditions
St. Francis
Area Rivers
St. Francis
Snowpack Depths
St. Francis
Reservoir Storage Capacity
St. Francis
Groundwater Levels
Recreational Opportunity Index (ROI): 2.8
The Recreational Opportunity Index (ROI) recognizes the value of outdoor recreational options, such as parks, hiking trails, camping sites, and fishing spots, while acknowledging that climate plays a pivotal role in ensuring the comfort and consistency of these experiences.
Access to outdoor recreational opportunities, encompassing activities such as parks, hiking, camping, and fishing, is crucial for overall well-being, and the climate plays a pivotal role in enabling and enhancing these experiences, ensuring that individuals can engage in nature-based activities comfortably and consistently.
Camping Areas
| Campground | Campsites | Reservations | Toilets | Showers | Elevation |
|---|---|---|---|---|---|
| Atwood Water Park | None | 218 ft | |||
| Fairview Riverside State Park | None | 4 ft | |||
| Timberlake - Ross Barnett Reservoir | 289 | 331 ft | |||
| Lake Lincoln State Park | None | 426 ft | |||
| Fontainebleau State Park | None | 18 ft | |||
| Lake Mary Crawford | 20 | 293 ft | |||
| New Orleans Reserve Military | None | 0 ft | |||
| Bayou Segnette State Park | None | 0 ft | |||
| Bogue Chitto Water Park | None | 276 ft | |||
| Lefleurs Bluff State Park | None | 288 ft |
Nearby Fishing
Nearby Ski Areas
Catastrophe Safeguard Index (CSI):
The Catastrophe Safeguard Index (CSI) recognizes that natural disaster risk, encompassing floods, fires, hurricanes, and tornadoes, can drastically affect safety and the overall appeal of an area.
The level of natural disaster risk in a region significantly affects safety and the overall livability, with climate change amplifying these risks by potentially increasing the frequency and intensity of events like floods, fires, hurricanes, and tornadoes, thereby posing substantial challenges to community resilience and well-being.
Community Resilience Indicator (CRI): 1.0
The Community Resilience Indicator (CRI) recognizes that education, healthcare, and socioeconomics are crucial to the well-being of a region. The CRI acknowledges the profound impact of these elements on residents' overall quality of life. By evaluating educational resources, healthcare accessibility, and economic inclusivity, the index captures the essential aspects that contribute to a thriving community, fostering resident satisfaction, equity, and social cohesion.