

-
 Snoflo Premium
Get unlimited access to all our content
With no Ad interruptions! - Start Your Free Trial Login with existing account
Moro
Eden Index
Climate
8.3
•
Recreation
2.8
•
Community
3.4
•
Safeguard
5.1/10
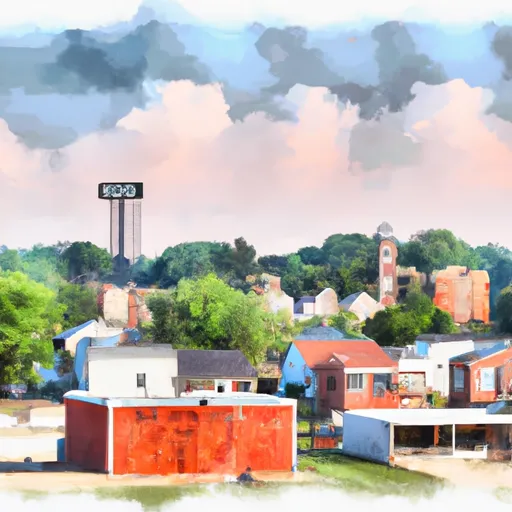
Moro, Illinois is a small village located in Madison County, in the southwestern part of the state. The climate in Moro is classified as a humid subtropical climate, characterized by hot and humid summers, and cool to mild winters. Summers are typically sunny with average temperatures ranging from the mid-80s to low 90s Fahrenheit, while winters see temperatures ranging from the 20s to 40s Fahrenheit.
Hydrology constituents in Moro are primarily influenced by the nearby Mississippi River. The village is situated about 10 miles east of the river, which provides a significant water source and recreational opportunities. Additionally, Moro is home to several small creeks and streams that contribute to the local hydrology.
Outdoor recreation opportunities in Moro primarily revolve around its natural surroundings. The area offers several parks and green spaces where residents and visitors can engage in activities such as hiking, picnicking, and bird-watching. The nearby Mississippi River also offers opportunities for boating, fishing, and other water-based activities. Additionally, the surrounding countryside provides scenic landscapes for exploring, biking, and camping. Overall, Moro's climate, hydrology, and outdoor opportunities make it an attractive destination for nature lovers and outdoor enthusiasts.
What is the Eden Index?
The Snoflo Eden Index serves as a comprehensive rating system for regions, evaluating their desirability through a holistic assessment of climate health, outdoor recreation opportunities, and natural disaster risk, acknowledging the profound impact of these factors on livability and well-being.
Climate Health Indicator (CHI): 8.3
Moro receives approximately
1007mm of rain per year,
with humidity levels near 82%
and air temperatures averaging around
13°C.
Moro has a plant hardyness factor of
6, meaning
plants and agriculture in this region thrive during a short period during spring and early summer. Most
plants will die off during the colder winter months.
By considering the ideal temperature range, reliable water supplies, clean air, and stable seasonal rain or snowpacks, the Climate Health Indicator (CHI) underscores the significance of a healthy climate as the foundation for quality living.
A healthy climate is paramount for ensuring a high quality of life and livability in a region, fostering both physical well-being and environmental harmony. This can be characterized by ideal temperatures, reliable access to water supplies, clean air, and consistent seasonal rain or snowpacks.
Weather Forecast
Streamflow Conditions
Upper Mississippi-Meramec
Area Rivers
Upper Mississippi-Meramec
Snowpack Depths
Upper Mississippi-Meramec
Reservoir Storage Capacity
Upper Mississippi-Meramec
Groundwater Levels
Recreational Opportunity Index (ROI): 2.8
The Recreational Opportunity Index (ROI) recognizes the value of outdoor recreational options, such as parks, hiking trails, camping sites, and fishing spots, while acknowledging that climate plays a pivotal role in ensuring the comfort and consistency of these experiences.
Access to outdoor recreational opportunities, encompassing activities such as parks, hiking, camping, and fishing, is crucial for overall well-being, and the climate plays a pivotal role in enabling and enhancing these experiences, ensuring that individuals can engage in nature-based activities comfortably and consistently.
Camping Areas
| Campground | Campsites | Reservations | Toilets | Showers | Elevation |
|---|---|---|---|---|---|
| DLo Water Park | None | 312 ft | |||
| Lake Mary Crawford | 20 | 293 ft | |||
| Bayou Segnette State Park | None | 0 ft | |||
| Lefleurs Bluff State Park | None | 288 ft | |||
| Fairview Riverside State Park | None | 4 ft | |||
| New Orleans Reserve Military | None | 0 ft | |||
| Atwood Water Park | None | 218 ft | |||
| Timberlake - Ross Barnett Reservoir | 289 | 331 ft | |||
| Fontainebleau State Park | None | 18 ft | |||
| St. Bernard State Park | None | 3 ft |
Nearby Fishing
Nearby Ski Areas
Catastrophe Safeguard Index (CSI):
The Catastrophe Safeguard Index (CSI) recognizes that natural disaster risk, encompassing floods, fires, hurricanes, and tornadoes, can drastically affect safety and the overall appeal of an area.
The level of natural disaster risk in a region significantly affects safety and the overall livability, with climate change amplifying these risks by potentially increasing the frequency and intensity of events like floods, fires, hurricanes, and tornadoes, thereby posing substantial challenges to community resilience and well-being.
Community Resilience Indicator (CRI): 3.4
The Community Resilience Indicator (CRI) recognizes that education, healthcare, and socioeconomics are crucial to the well-being of a region. The CRI acknowledges the profound impact of these elements on residents' overall quality of life. By evaluating educational resources, healthcare accessibility, and economic inclusivity, the index captures the essential aspects that contribute to a thriving community, fostering resident satisfaction, equity, and social cohesion.