California Snowpack & Snow Report
As of Nov 22, 2026, California's snowpack is at 57% of normal across 49 SNOTEL stations — the deepest is 124" at Nohrsc Tuolumne Meadows. Live SNOTEL snow depth, snowfall, snow-water equivalent, and 5-day forecasts for every mountain in California.
California snow map
See California’s snow on a live map
Every snow station and ski area, one tap each:
- On the ground — how deep it is now
- Last 24 hrs — who got new snow
- Coming up — 24/48/72-hr forecast, press play
✓ Free for 7 days · ✓ Cancel anytime
California snow conditions today
What’s on the ground, how it compares to normal and what’s coming — refreshed daily from SNOTEL and NOAA.
California's snowpack is at 57% of normal for today's date — well below the 70% drought-stress threshold. The deepest station is Nohrsc Tuolumne Meadows with 124" on the ground (seasonal average 97"). Blackcap Basin Goes is the coldest right now at 43°F.
The California snowpack is monitored by the USDA NRCS SNOTEL network — automated stations sitting on the mountain that report snow depth, snow water equivalent (SWE), and air temperature every hour. Snoflo joins those live readings to a 5-day NOAA forecast for each station so you can see what's on the ground and what's coming.
Use the SNOTEL inventory below to find the closest station to where you're headed. Percent of normal tells you how today's snowpack compares to the historical average for the same date — below 70% is drought-stressed; above 130% is a fat year. Snow water content (SWC) indicates how wet and dense the snowpack is — useful for water-supply planning and avalanche stability assessment.
For backcountry travel always cross-reference with your regional avalanche center at avalanche.org.
California snow report
| Snowpack monitoring site | Snowpack (in) | Snowfall (in) | 24hr fcst (in) | Next 72hrs (in) | Temp (°F) | % Normal | SWC (%) | Watershed | Elevation (ft) |
|---|---|---|---|---|---|---|---|---|---|
|
Stouts Meadow Goes, Ca
Site STMC1 |
97 | 0 | 0 | 1 | 31 | % | 10% | Mccloud | 5,297 |
|
Nohrsc Horse Meadows, Ca
Site HRSC1 |
48 | 0 | 0 | 1 | 26 | 273% | 19% | Upper Tuolumne | 8,607 |
|
Nohrsc Mt Rose Ski Area, Ca
Site MRSN2 |
46 | 0 | 0 | 0 | 26 | 262% | 17% | Truckee | 8,817 |
|
Nohrsc Leavitt Lake, Ca
Site LELC1 |
45 | 0 | 0 | 0 | 24 | 245% | 24% | West Walker | 9,604 |
|
Leavitt Lake, Ca
Site 574 |
45 | 0 | 0 | 0 | 29 | 245% | 24% | West Walker | 9,617 |
|
Nohrsc Elstanislaus Meadow (Goes), Ca
Site SLMC1 |
45 | 0 | 0 | 1 | 30 | % | 23% | Upper Stanislaus | 7,738 |
|
Lost Lake Snotel, Ca
Site LLXC1 |
43 | 0 | 0 | 1 | 26 | % | 21% | Upper Mokelumne | 8,679 |
|
Independence Lake, Ca
Site 541 |
36 | -1 | 0 | 0 | 26 | 231% | 19% | Truckee | 8,352 |
|
Squaw Valley G.C., Ca
Site 784 |
34 | 0 | 0 | 0 | 29 | 270% | 21% | Truckee | 8,029 |
|
Nohrsc Ward Creek #3, Ca
Site WRDC1 |
34 | 0 | 0 | 0 | 29 | % | 19% | Lake Tahoe | 6,786 |
|
Nohrsc Palisades Tahoe, Ca
Site SQWC1 |
33 | 0 | 0 | 0 | 29 | % | 22% | Truckee | 7,961 |
|
Nohrsc Green Mtn, Ca
Site GRMC1 |
32 | 0 | 0 | 0 | 33 | 132% | 6% | Upper San Joaquin | 7,902 |
|
Blackcap Basin Goes, Ca
Site BCBC1 |
31 | 0 | 0 | 0 | 24 | 193% | 20% | Upper King | 10,292 |
|
Nohrsc Sonora Pass, Ca
Site SRAC1 |
31 | 0 | 0 | 0 | 30 | % | 19% | West Walker | 8,777 |
|
Nohrsc Echo Peak, Ca
Site ECOC1 |
29 | 0 | 0 | 0 | 29 | 256% | 20% | Lake Tahoe | 7,649 |
|
Nohrsc Rubicon #2, Ca
Site RUBC1 |
29 | 0 | 0 | 0 | 35 | % | 15% | Lake Tahoe | 7,551 |
|
Nohrsc Monitor Pass, Ca
Site MNPC1 |
26 | 0 | 0 | 0 | 27 | 300% | 15% | West Walker | 8,321 |
|
Nohrsc Big Meadow, Ca
Site BMWN2 |
25 | 0 | 0 | 0 | 28 | % | 18% | Truckee | 8,249 |
|
Nohrsc Tuolumne Meadows, Ca
Site TUMC1 |
25 | 0 | 0 | 0 | 30 | 246% | 19% | Upper Tuolumne | 8,640 |
|
Nohrsc Poison Flat, Ca
Site XXXC1 |
25 | 0 | 0 | 0 | 31 | % | 17% | Upper Carson | 7,770 |
|
Nohrsc Summit Meadow, Ca
Site SDWC1 |
24 | 0 | 0 | 0 | 28 | % | 20% | West Walker | 9,358 |
|
Nohrsc Truckee #2, Ca
Site TRUC1 |
22 | 0 | 0 | 0 | 34 | % | 17% | Truckee | 6,514 |
|
Tahoe City Cross, Ca
Site 809 |
20 | 0 | 0 | 0 | 34 | % | 14% | Lake Tahoe | 6,797 |
|
Nohrsc Rock Creek, Ca
Site RCKC1 |
20 | 0 | 0 | 0 | 29 | % | 6% | Crowley Lake | 9,715 |
|
Nohrsc Heavenly Valley Snotel, Ca
Site HVNC1 |
20 | 0 | 0 | 0 | 29 | 212% | 18% | Lake Tahoe | 8,571 |
|
Nohrsc Tahoe City Cross, Ca
Site THOC1 |
20 | 0 | 0 | 0 | 31 | % | 14% | Lake Tahoe | 6,790 |
|
Nohrsc Harkness Flat Near Chester 8nnw, Ca
Site HRKC1_MADIS |
19 | 0 | 1 | 2 | 32 | 194% | 20% | North Fork Feather | 6,330 |
|
Leavitt Meadows, Ca
Site 575 |
18 | 0 | 0 | 0 | 35 | % | 19% | West Walker | 7,198 |
|
Nohrsc Virginia Lakes Ridge, Ca
Site VGAC1 |
18 | 0 | 0 | 0 | 27 | % | 14% | East Walker | 9,433 |
|
Cottonwood Lakes, Ca
Site CWDC1 |
17 | 0 | 0 | 0 | 31 | 196% | 6% | Owens Lake | 10,211 |
|
Nohrsc Willow Flat Snotel, Ca
Site WFSC1 |
17 | 0 | 0 | 0 | 32 | % | 17% | West Walker | 8,262 |
|
Nohrsc Middle Boulder 3 Snow Course, Ca
Site MDBC1 |
16 | 0 | 0 | 5 | 31 | % | 10% | Scott | 6,098 |
|
Ravendale Raws, Ca
Site RVDC1 |
14 | 0 | 0 | 0 | 34 | % | % | Madeline Plains | 5,438 |
|
Spratt Creek, Ca
Site 778 |
12 | 0 | 0 | 0 | 39 | % | 21% | Upper Carson | 6,115 |
|
Nohrsc Spratt Creek, Ca
Site SPCC1 |
12 | 0 | 0 | 0 | 39 | % | 21% | Upper Carson | 6,104 |
|
Mission Ridge Snow Pillow, Ca
Site MSRQ2 |
10 | 0 | 0 | 0 | 48 | 102% | 32% | Lower Pit | 1,069 |
|
Dismal Swamp, Ca
Site 446 |
9 | 0 | 0 | 0 | 24 | 100% | 24% | Warner Lakes | 7,360 |
|
Fallen Leaf, Ca
Site 473 |
9 | 0 | 0 | 0 | 38 | % | 27% | Lake Tahoe | 6,236 |
|
Fallen Leaf Lake, Ca
Site FLFC1 |
9 | 0 | 0 | 0 | 38 | 4800% | 26% | Lake Tahoe | 6,258 |
|
Nohrsc Adin Mtn, Ca
Site ADMC1 |
8 | 0 | 0 | 1 | 32 | 123% | 18% | Upper Pit | 6,196 |
|
Adin Mtn, Ca
Site 301 |
8 | 0 | 0 | 1 | 32 | 130% | 19% | Upper Pit | 6,190 |
|
Highlands Lakes, Ca
Site HIGC1 |
8 | 0 | 0 | 5 | 29 | 0% | % | Trinity | 5,920 |
|
Nohrsc Cedar Pass, Ca
Site CDRC1 |
7 | 0 | 0 | 0 | 32 | % | % | Upper Pit | 7,075 |
|
Cedar Pass, Ca
Site 391 |
6 | -1 | 0 | 0 | 28 | 0% | · | Upper Pit | 7,030 |
|
Juniper Creek, Ca
Site JPRC1 |
4 | 0 | 0 | 0 | 39 | % | % | Upper Pit | 4,636 |
|
Alturas 9.5 E, Ca
Site CA-MC-4 |
3 | 0 | 0 | 0 | 36 | % | 9% | Upper Pit | 5,335 |
|
Susanville 3.2 Ssw, Ca
Site CA-LS-1 |
2 | 0 | 0 | 0 | 40 | % | % | Honey-Eagle Lakes | 4,354 |
|
Blue Door Goes, Ca
Site BDOC1 |
2 | 0 | 0 | 0 | 32 | % | % | Upper Pit | 5,928 |
|
Nohrsc 20h01 - State Line Am (Ca), Ca
Site TATC1 |
1 | 0 | 0 | 0 | 32 | % | 20% | Lost | 5,694 |
California ski forecast
Per-resort interactive weather forecasts for the next 15 days — temperature curve, precipitation bars, weather symbols, and humidity at every California ski area Snoflo tracks.
-
 Alpine Meadows Ski Area15-day forecast
Ski report →
-
 Alta Sierra At Shirley Meadows15-day forecast
Ski report →
-
 Badger Pass Ski Area15-day forecast
Ski report →
-
 Bear Mountain15-day forecast
Ski report →
-
 Bear Mountain Resort15-day forecast
Ski report →
-
 Bear Valley Mountain Resort15-day forecast
Ski report →
-
 Boreal Mountain Resort15-day forecast
Ski report →
-
 Buckhorn Ski Club15-day forecast
Ski report →
-
 China Peak (Sierra Summit)15-day forecast
Ski report →
-
 Cuyamaca Peak15-day forecast
Ski report →
-
 Dodge Ridge Ski Area15-day forecast
Ski report →
-
 Donner Ski Ranch15-day forecast
Ski report →
-
 Granlibakken Ski Resort15-day forecast
Ski report →
-
 Homewood Mountain Resort15-day forecast
Ski report →
-
 June Mountain15-day forecast
Ski report →
-
 Kirkwood15-day forecast
Ski report →
-
 Mammoth Mountain15-day forecast
Ski report →
-
 Mount Baldy15-day forecast
Ski report →
-
 Mountain High Resort15-day forecast
Ski report →
-
 Mt. Baldy Ski Lifts15-day forecast
Ski report →
-
 Mt. Waterman15-day forecast
Ski report →
-
 Northstar15-day forecast
Ski report →
-
 Sierra At Tahoe15-day forecast
Ski report →
-
 Snow Summit Mountain Resort15-day forecast
Ski report →
-
 Snow Valley Ski Resort15-day forecast
Ski report →
-
 Soda Springs15-day forecast
Ski report →
-
 Squaw Valley15-day forecast
Ski report →
-
 Sugar Bowl Resort15-day forecast
Ski report →
-
 Sunrise15-day forecast
Ski report →
-
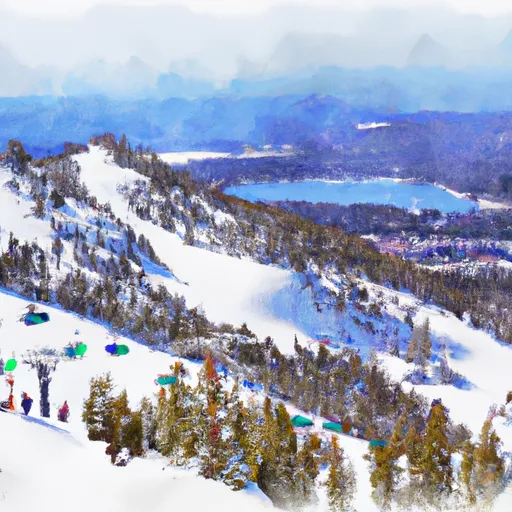 Tahoe Donner15-day forecast
Ski report →
-
 Trinity Mountain Resort15-day forecast
Ski report →
About California snowpack
What is California's snowpack right now?
As of November 22, 2026, California's snowpack is at 57% of normal across 49 SNOTEL stations, and the deepest station is Nohrsc Tuolumne Meadows with 124" on the ground. The full SNOTEL table is below.
Where is the deepest snow in California right now?
As of November 22, 2026, the deepest snowpack in California is 124" at Nohrsc Tuolumne Meadows. See the SNOTEL station table for the full ranking by depth and snow-water equivalent.
Is California's snowpack above or below normal?
Compare the statewide percent-of-normal on this page: 100% is right at the historical average for the date, below 70% is drought-stressed, and above 130% is a well-above-normal year. Each SNOTEL station also shows its own percent of normal.
Where does the California snowpack data come from?
The USDA NRCS SNOTEL network (SNOpack TELemetry) -- automated mountain stations that continuously measure snow depth, snow water equivalent, precipitation, and air temperature. Snoflo aggregates the live readings and joins them to a 5-day NOAA forecast for each station.
What is Snow Water Equivalent (SWE)?
The depth of water you'd get if you melted the entire snowpack. A 30-inch snowpack with 8 inches of SWE is wetter and denser than one with 5 inches -- useful for water-supply forecasting and avalanche assessment. The "SWC %" column shows the ratio.
What does Percent Normal mean?
Current snowpack as a percentage of the historical average for the same date at that station. 100% is right at the historical norm. Below 70% indicates drought-stressed snowpack; above 130% is a fat year.
How fresh is the California data?
SNOTEL stations transmit hourly; Snoflo re-pulls throughout the day. The 5-day forecasts regenerate from NOAA NOHRSC analysis fields and NWS forecast guidance.
Why are SNOTEL stations only in some states?
The NRCS SNOTEL network is concentrated in the western mountain U.S. -- where the snowpack drives federal water supply forecasts for irrigation, hydropower, and municipal water. Eastern snowpack is measured by other networks (CoCoRaHS, NWS) which Snoflo includes elsewhere.
Is this a substitute for the local avalanche center?
No. For backcountry travel always consult your regional avalanche forecast at avalanche.org. Snoflo is informational data only.