Flood Watch
2026-10-23T12:00:00-06:00

* WHAT...Flooding caused by excessive rainfall continues to be possible. * WHERE...Portions of southwest Colorado, including the following areas, Animas River Basin, Four Corners/Upper Dolores River, San Juan River Basin and Southwest San Juan Mountains and Utah, including the following areas, Arches/Grand Flat, Canyonlands/Natural Bridges, La Sal and Abajo Mountains and Southeast Utah. * WHEN...Through Friday morning. * IMPACTS...Excessive runoff may result in flooding of rivers, creeks, streams, recent burn scars and other low-lying and flood-prone locations. Low-water crossings may be flooded. Storm drains and ditches may become clogged with debris. * ADDITIONAL DETAILS... - Strong thunderstorms capable of producing heavy rain will be possible across southern portions of Utah and Colorado through Thursday evening. In addition widespread moderate to heavy rainfall from a surge of tropical moisture will remain a threat through early Friday morning. - http://www.weather.gov/safety/flood
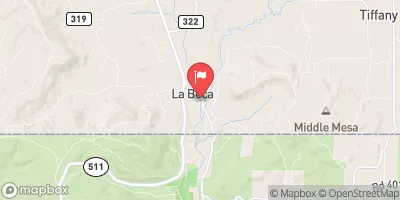
Los Pinos River At La Boca, Co. Historical Data

Historical Data


Streamflow Range


Date Average 2026 2025 2024 2023 2022 2021 2020 2019 2018 2017 2016 2015 2014 2013 2012 2011
01-01 27.6
01-02 29.45
01-03 33.95
01-04 32.2
01-05 47.35
01-06 38.5
01-07 38.0
01-08 37.1
01-09 44.9
01-10 47.43
01-11 44.5
01-12 48.3
01-13 85.0
01-14 71.25
01-15 90.0
01-16 107.0
01-17 103.0
01-18 98.0
01-19 96.0
01-20 101.0
01-21 100.0
01-22 100.0
01-23 93.0
01-24 98.0
01-25 95.0
01-26 65.7
01-27 68.9
01-28 72.55
01-29 81.55
01-30 78.0
01-31 84.87
02-01 155.2
02-02 108.43
02-03 114.67
02-04 74.8
02-05 63.26
02-06 56.88
02-07 56.47
02-08 55.79
02-09 60.43
02-10 66.48
02-11 75.25
02-12 66.26
02-13 66.7
02-14 59.23
02-15 57.3
02-16 56.28
02-17 59.2
02-18 79.04
02-19 58.43
02-20 73.95
02-21 93.77
02-22 102.31
02-23 96.13
02-24 93.69
02-25 97.37
02-26 87.23
02-27 82.2
02-28 89.29
02-29 117.55
03-01 90.18
03-02 89.48
03-03 94.55
03-04 101.78
03-05 123.83
03-06 118.76
03-07 128.21
03-08 143.64
03-09 152.61
03-10 142.11
03-11 143.16
03-12 240.1
03-13 286.05
03-14 201.74
03-15 185.5
03-16 224.43
03-17 204.48
03-18 170.31
03-19 189.6
03-20 196.8
03-21 198.97
03-22 240.83
03-23 271.33
03-24 311.86
03-25 222.63
03-26 232.31
03-27 231.63
03-28 209.61
03-29 205.96
03-30 223.78
03-31 218.41
04-01 212.08
04-02 218.51
04-03 283.26
04-04 245.78
04-05 297.7
04-06 220.87
04-07 245.91
04-08 264.95
04-09 315.85
04-10 375.81
04-11 233.06
04-12 215.6
04-13 278.35
04-14 298.31
04-15 225.79
04-16 204.63
04-17 155.44
04-18 167.23
04-19 172.87
04-20 170.15
04-21 155.71
04-22 149.29
04-23 141.6
04-24 140.66
04-25 161.47
04-26 142.95
04-27 143.24
04-28 143.24
04-29 142.86
04-30 149.42
05-01 142.39
05-02 135.92
05-03 145.58
05-04 138.85
05-05 131.45
05-06 127.81
05-07 140.0
05-08 118.49
05-09 136.55
05-10 143.1
05-11 147.7
05-12 155.21
05-13 154.82
05-14 151.13
05-15 151.78
05-16 184.2
05-17 190.86
05-18 193.17
05-19 196.97
05-20 250.56
05-21 244.0
05-22 264.05
05-23 227.42
05-24 221.3
05-25 233.17
05-26 226.61
05-27 256.34
05-28 241.62
05-29 244.87
05-30 264.05
05-31 266.57
06-01 318.72
06-02 328.55
06-03 350.63
06-04 401.27
06-05 392.11
06-06 414.71
06-07 555.52
06-08 526.94
06-09 488.81
06-10 477.29
06-11 510.11
06-12 394.04
06-13 383.82
06-14 370.43
06-15 376.03
06-16 357.03
06-17 332.59
06-18 326.03
06-19 319.74
06-20 352.4
06-21 290.73
06-22 274.84
06-23 244.93
06-24 150.96
06-25 261.14
06-26 243.81
06-27 287.94
06-28 223.59
06-29 226.95
06-30 240.96
07-01 246.61
07-02 237.41
07-03 244.24
07-04 246.73
07-05 207.81
07-06 163.23
07-07 129.84
07-08 170.94
07-09 192.99
07-10 167.45
07-11 146.67
07-12 139.43
07-13 104.11
07-14 146.08
07-15 147.46
07-16 152.89
07-17 136.17
07-18 125.53
07-19 146.97
07-20 137.23
07-21 116.37
07-22 121.06
07-23 114.71
07-24 112.52
07-25 125.01
07-26 130.51
07-27 140.4
07-28 233.83
07-29 158.21
07-30 142.99
07-31 179.07
08-01 127.22
08-02 129.12
08-03 135.61
08-04 126.89
08-05 140.01
08-06 130.63
08-07 114.47
08-08 123.21
08-09 111.9
08-10 114.28
08-11 109.67
08-12 110.99
08-13 111.93
08-14 114.17
08-15 110.75
08-16 104.74
08-17 103.2
08-18 102.11
08-19 105.31
08-20 103.07
08-21 102.55
08-22 101.13
08-23 107.52
08-24 103.89
08-25 111.86
08-26 117.11
08-27 119.45
08-28 113.72
08-29 110.84
08-30 107.51
08-31 105.11
09-01 104.18
09-02 113.27
09-03 107.03
09-04 103.02
09-05 106.15
09-06 130.59
09-07 107.09
09-08 99.28
09-09 100.47
09-10 107.05
09-11 114.58
09-12 117.33
09-13 131.83
09-14 123.2
09-15 201.51
09-16 156.82
09-17 127.28
09-18 198.23
09-19 119.75
09-20 114.52
09-21 107.07
09-22 123.64
09-23 254.56
09-24 142.53
09-25 114.4
09-26 127.74
09-27 108.02
09-28 127.07
09-29 212.77
09-30 185.0
10-01 207.66
10-02 127.57
10-03 155.65
10-04 145.87
10-05 150.31
10-06 142.62
10-07 128.68
10-08 104.71
10-09 102.79
10-10 101.63
10-11 119.67
10-12 101.79
10-13 73.98
10-14 199.62
10-15 112.39
10-16 66.22
10-17 53.16
10-18 51.09
10-19 51.67
10-20 51.86
10-21 56.28
10-22 129.39
10-23 49.98
10-24 42.98
10-25 41.01
10-26 57.51
10-27 67.17
10-28 57.44
10-29 55.03
10-30 54.97
10-31 54.02
11-01 55.6
11-02 36.89
11-03 53.03
11-04 47.59
11-05 50.31
11-06 49.25
11-07 45.15
11-08 46.51
11-09 44.34
11-10 48.48
11-11 48.82
11-12 43.54
11-13 42.5
11-14 42.08
11-15 44.0
11-16 43.32
11-17 47.81
11-18 39.39
11-19 39.48
11-20 39.73
11-21 47.88
11-22 59.08
11-23 55.86
11-24 55.77
11-25 53.91
11-26 49.42
11-27 44.35
11-28 45.96
11-29 50.88
11-30 50.14
12-01 47.65
12-02 44.33
12-03 40.72
12-04 42.39
12-05 42.76
12-06 41.34
12-07 39.71
12-08 35.11
12-09 39.6
12-10 39.0
12-11 35.46
12-12 32.17
12-13 35.57
12-14 40.85
12-15 43.88
12-16 40.72
12-17 41.18
12-18 55.42
12-19 42.67
12-20 43.26
12-21 44.1
12-22 44.92
12-23 43.77
12-24 57.85
12-25 50.08
12-26 51.42
12-27 28.45
12-28 28.65
12-29 25.75
12-30 29.55
12-31 28.65

Annual Peak Streamflow


Seasonal Comparison


Oceanic Nino Index